In 2026, revenue leaders are not short of data. They actually have too many metrics and not enough clarity.
Dashboards are loaded with charts. Reports also keep coming weekly. However, forecasts still miss the targets, deals still get stuck, and employees still argue about whose numbers are correct. This gap explains why companies are rethinking their RevOps metrics and redefining what really matters.
Good leaders nowadays pose a more intelligent question: Which Revenue Operations KPIs help us make better decisions—and which ones only slow us down?
Why Traditional RevOps Reporting No Longer Reflects Reality
Most companies set up their RevOps reports primarily to cater to departmental needs instead of revenue results. So, Sales monitors the pipeline value, Marketing keeps a tab on the lead volume, and Finance tends the booked revenue. Actually, these figures have some meaning when viewed independently, but they don’t really explain what growth is all about.
In 2026, sales, marketing and customer success teams are dealing with:
- Longer duration of decision-making
- More stakeholders per deal
- Implementing and usage-based pricing models
- Being accountable for profitable growth, not just growth at any cost
Thus, the old dashboards are not capable of supporting such a level of sophistication. Executives require business intelligence that allows them to understand cause and effect, not just activity.
What Goes Wrong When You Have Too Many RevOps Dashboards
At present, it is very easy to get carried away with metrics when using modern tools. The Outcome? You have loads of metrics, many of which are merely “vanity” ones that look cool but actually add very little value.
The major signs of this issue are:
- Each team has their own trusted numbers
- Too many reporting meetings with no action resulting from them
- Metrics that show what happened but don’t predict the future
In 2026, the most successful RevOps teams are those that simplify. They decrease the number of metrics they track—but they also carefully select the right ones.
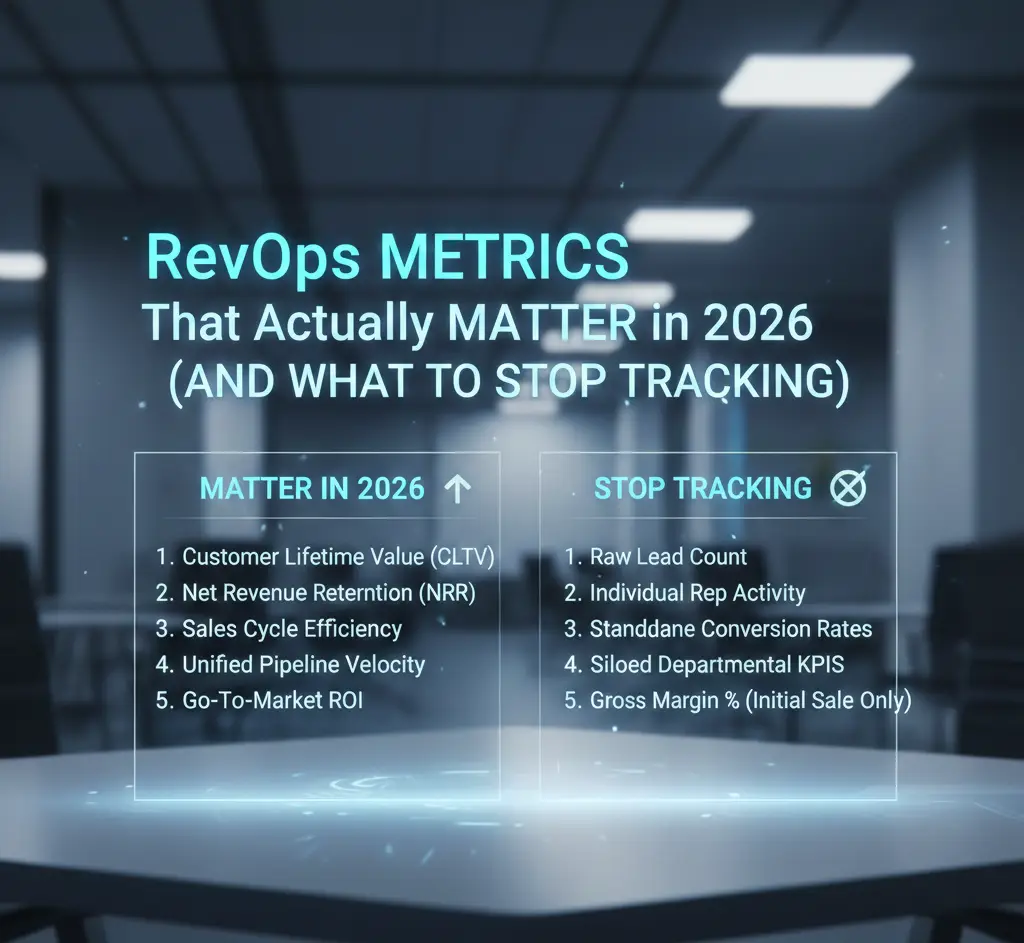
RevOps Metrics That Actually Matter in 2026
1. Revenue Velocity (Not Just Pipeline Size)
The sole consideration of pipeline value does not tell you anything about the pace or effectiveness of your sales effort. Revenue velocity reveals the speed at which revenue is flowing through your sales system.
This metric takes into account:
- The count of sales-qualified leads
- The average size of a deal
- The ratio of successfully closed deals to total sales
- The duration of the overall sales process
Revenue velocity allows executives to understand their near-term growth potential, and it also pinpoints the stages of the sales process at which little or no progress is made.
2. Funnel Conversion by Stage
Rather than monitoring the volume of leads, high-performing teams pay attention to sales funnel performance metrics that uncover “leakage.
Some of the items they look at include:
- Lead-to-opportunity conversion rate
- Opportunity-to-close ratio
- Transition rate between stages
These metrics indicate the moments at which there is more friction in the process, and they enable RevOps to not only increase sales but also provide a better customer experience.
3. Forecast Accuracy
One of the most important KPIs for Revenue operations in 2026 has been forecast accuracy.
It has become standard for executives to look at:
- Forecast compared to actual revenue
- Forecast accuracy segmentation by product, region, and customer type
- Forecast confidence trend over a given period
High forecast accuracy implies that a company is operationally mature. A low accuracy warning is a sign that a company is struggling with unclear or missing data, faulty processes, or inadequately aligned incentives.
4. Net Revenue Retention (NRR)
The reliance on new deals for growth is not sustainable in the long run. It is retention and growth that establish the foundation of revenue.
NRR sheds light on:
- How much of your revenue base is stable
- How successful your upselling and cross-selling endeavours are
- To what extent does your growth depend on replacing churn
This metric is often pointed out as the most critical SaaS revenue KPI for 2026.
5. Cost to Revenue Ratio
RevOps metrics nowadays include both aspects of growth and efficiency.
Alongside sales and marketing teams, customer success also contributes to it by influencing:
- Cost to acquire revenue
- Cost to support and expand revenue
- The impact on your margin of the sales complexity
When you look at the bigger picture, this metric can be seen to measure the direct relationship between the RevOps function and profitability, and it is also in line with financial and FinOps goals.
RevOps Metrics You Should Stop Tracking
As well as what to track, it is equally important to know what to stop tracking.
1. Raw Lead Volume
Just a large number of leads is no guarantee that a company will generate a lot of revenue. Instead, teams are concentrating on the quality of leads and their conversion potential.
2. Activity Metrics Without Context
Metrics such as calls, emails, and meetings are part of the overall noise that obscures the view, especially when there is no evidence that they can bring about any outcomes.
3. Single-Point Pipeline Snapshots
It is deceptive to show leaders the pipeline at a certain moment and only that moment. Team leaders today use trend-based revenue analytics to back up their sales strategies and plans.
4. Lagging Revenue Metrics Alone
Revenue that has been booked is certainly a very important measure, but the problem with it is that when you don’t have any leading indicators, then it’s too late to influence the outcome.
How Modern RevOps Teams Use Revenue Analytics
A good revenue analytics system should provide answers to your questions before you even get to know what problems you are having, or at least this is what a really good one will do.
The most successful teams leverage their analytics capabilities to:
- Find out whether a deal is at risk early enough
- Spot opportunities for expansion
- Focus on the accounts that have the greatest lifetime value
- Make sure that the sales efforts are aligned with the revenue impacts
Practically, analytics bring about a shift in the role of RevOps from being reporters of past results to shapers of future outcomes.
Designing RevOps Dashboards That Drive Action
What effectively working RevOps dashboards have in common are three things:
- They support decision-making rather than just showing data
- They link together metrics across teams
- They reflect changes as they happen
Instead of making dashboards for every function or role, the most modern RevOps teams come up with a single integrated revenue perspective that everyone from marketing, sales, customer success, and finance trusts.
Final Thoughts: Fewer Metrics, Better Decisions
In 2026, the most successful revenue teams can be described as winners, and they win by doing less and doing it better.
They pay attention to RevOps metrics that:
- Provide an explanation of what is going on with revenue
- Allow forecasting of future results
- Encourage and facilitate cross-team collaboration
They quit using those superficial numbers that just take up unnecessary space on the dashboards, but the decisions barely move as a result of them.
RevOps’ future is not with the teams that have the greatest number of metrics. It is with the teams that have the clearest insight into revenue.
Frequently Asked Questions (FAQs)
1. What are the key RevOps metrics to look at in 2026?
The key RevOps metrics in 2026 are revenue velocity, funnel conversion rates, forecast accuracy, net revenue retention, and cost-to-revenue ratio. By monitoring these metrics, teams can forecast results better and make smarter decisions.
2. In which ways do Revenue Operations KPIs differ from traditional sales KPIs?
While Revenue operations KPIs capture the complete revenue lifecycle, traditional sales KPIs only look at the sales pipeline and closed deals. RevOps KPIs are designed to bring sales, marketing, customer success, and finance on the same page to achieve joint revenue goals.
3. What are the reasons for RevOps dashboards not adding value?
Some RevOps dashboards fail because they record excessive vanity metrics without explanation. Good dashboards give actionable insights to help leaders understand risk, opportunity, and revenue flow.
4. In what way does revenue analytics bring value to RevOps reporting?
Revenue analytics takes RevOps reporting to the next level by uncovering trends, warning of potential problems, and spotting new customer acquisition and expansion opportunities. Analytics turns reporting from being solely based on past events to including predictions of future happenings, too.
5. What metrics are not useful for RevOps teams?
RevOps teams should abandon raw lead volume, activity metrics in isolation, and static pipeline snapshots. Such figures usually generate noise and seldom lead to better revenue results in modern revenue operations.